Customer retention is a fundamental driver of business growth and profitability, but it varies across industries. Each industry faces distinct challenges and opportunities that significantly affect loyalty.
In 2026, retention rates vary significantly depending on customer expectations, service quality, and market trends. This knowledge will enable companies to concentrate their efforts in specific areas.
This article outlines average retention rates by industry, so you can leverage this information to develop a strategy to retain your customers longer.
Top highlight
Customer retention rates vary widely across businesses, and data from recent sources indicate stabilization or a slight increase through 2026, driven by increased emphasis on personalization.
Commercial Insurance: 86% Tops charts with high retention from sticky contracts; expected to hold in 2026.
Business Consulting: 85% Relies on tailored advice and trust; stable outlook ahead.
IT & Managed Services: 83% Boosted by tech integration hurdles; minor gains projected.
SaaS/Software: 85-90% Benchmark driven by success teams; strengthening in 2026.
Financial Services: 80-90% Anchored by regulations and inertia; consistent performance.
eCommerce: 62% Struggles with competition; needs personalization to rebound.
Average retention rates by industry
The sad fact is that retention benchmarks can vary widely across industries. But having a handle on where your industry stands helps you set realistic goals and spot where there’s room to improve.
Overview of the latest cross-industry averages
Here’s how retention rates stack up across major industries in 2025-2026:
| Industry | Average Retention Rate | Primary Drivers |
|---|---|---|
| Saas/Software (enterprise) | 90% – 95% | Industry-wide focus on customer success |
| Media | 84% | Habitual engagement through subscription models |
| Professional Services | 84% | Long-term personalized client relationships |
| Automotive & Transportation | 83% | Recurring maintenance and ownership cycles |
| Insurance | 83% | Annual renewals and high switching friction |
| IT Services | 81% | Dependency on integrations and support |
| Construction & Engineering | 80% | Trust-based project work and repeat contracts |
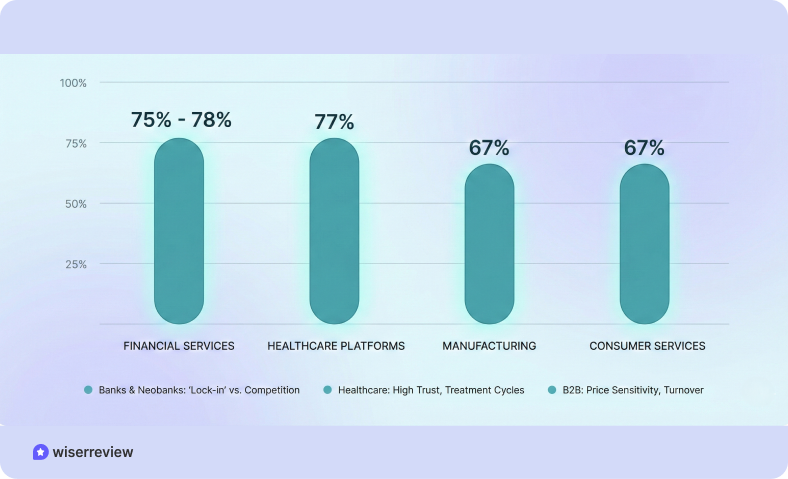
| Financial Services / Banking | 75% – 78% | High friction to switch; account lock-in |
| Telecom | 78% | Contractual obligations and bundled plans |
| Healthcare | 77% | Necessity and recurring treatment visits |
| Manufacturing | 67% | Transactional focus and price sensitivity |
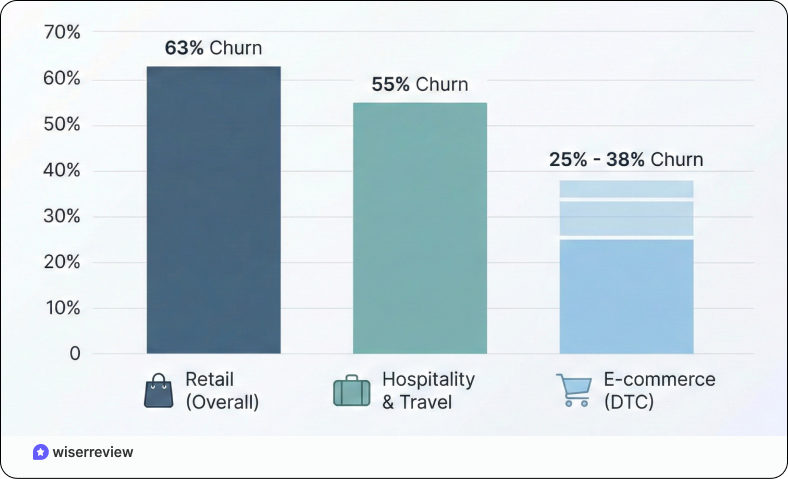
| Retail | 63% | Low brand loyalty and high choice overload |
| Hospitality & Travel | 55% | Price sensitivity and seasonal demand |
| E-commerce | 25% – 38% | Amazon effect: low switching costs |
High-retention industries
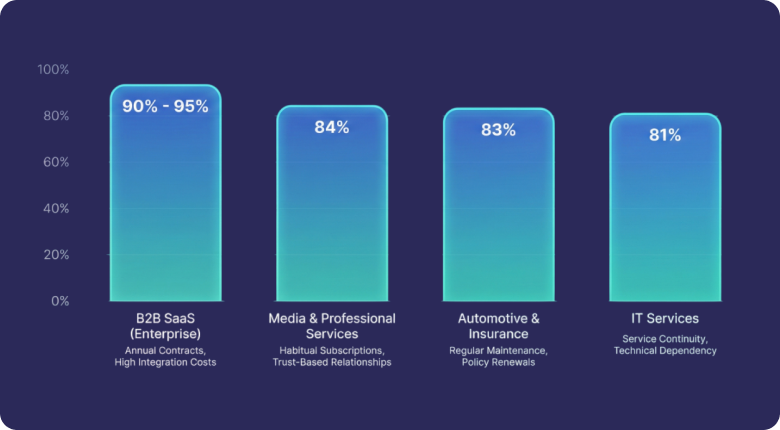
These sectors benefit from high “stickiness,” often due to long-term contracts, integrated services, or habitual use.
- B2B SaaS (Enterprise): 90% – 95%. Large-scale software benefits from annual contracts and high integration costs.
- Media & Professional Services: 84%. Driven by habitual subscription use (Media) and deep, trust-based client relationships (Services).
- Automotive & Insurance: 83%. Regular maintenance cycles and annual policy renewals keep these rates high.
- IT Services: 81%. Service continuity and deep technical dependency make switching difficult.
Mid‐range retention industries
These industries have solid foundations but face more competition or slightly lower switching friction.
- Financial Services: 75% – 78%. Banks and credit unions maintain steady rates due to account “lock-in,” but digital neobanks are increasing competition.
- Healthcare Platforms: 77%. Periodic drop-offs between treatment cycles offset high trust.
- Manufacturing: 67%. B2B trust is strong, but relationships are often sensitive to price fluctuations and champion turnover.
- Consumer Services: 67%. A mix of loyal habitual users and one-off casual customers.
Lower-retention industries
Characterized by low switching costs, high price sensitivity, and significant choice overload.
- Retail (Overall): 63%. Extremely commoditized and deal-driven, making loyalty difficult to sustain.
- Hospitality & Travel: 55%. High churn occurs because customers often prioritize price and seasonal deals over specific brands.
- E-commerce (DTC): 25% – 38%. Low switching barriers and the “Amazon effect” drive very high first-purchase churn.
2026 forecast & trends
Early indicators point to a divergence in performance driven by technology adoption.
- SaaS & IT (Projected 1%–2% Increase): Industry-wide adoption of AI-driven customer success and automated onboarding is expected to boost retention by improving early-stage value realization.
- Hospitality (Projected Growth): High-end vacation loyalty programs are gaining popularity, which is expected to lift these rates from their 2025 lows gradually.
- Retail (Projected Decline): If investment in SKU-level personalization does not become paramount, the retail retention rate may erode over time as consumers become increasingly price-sensitive.
- AI Personalization Mandate: By 2026, organizations employing predictive product analytics are expected to achieve an NRR of at least 15% higher than those employing static outreach.
- Employee Retention Shift: In 2026, more than 85% of professionals believe underscoring upskilling is essential for retaining employees, especially in technology fields affected by artificial intelligence.
All your reviews in one place
Collect reviews, manage every response, and display them where they matter most.
Why retention rates vary so much by industry
Understanding what drives retention differences helps you identify which levers to pull in your own business.
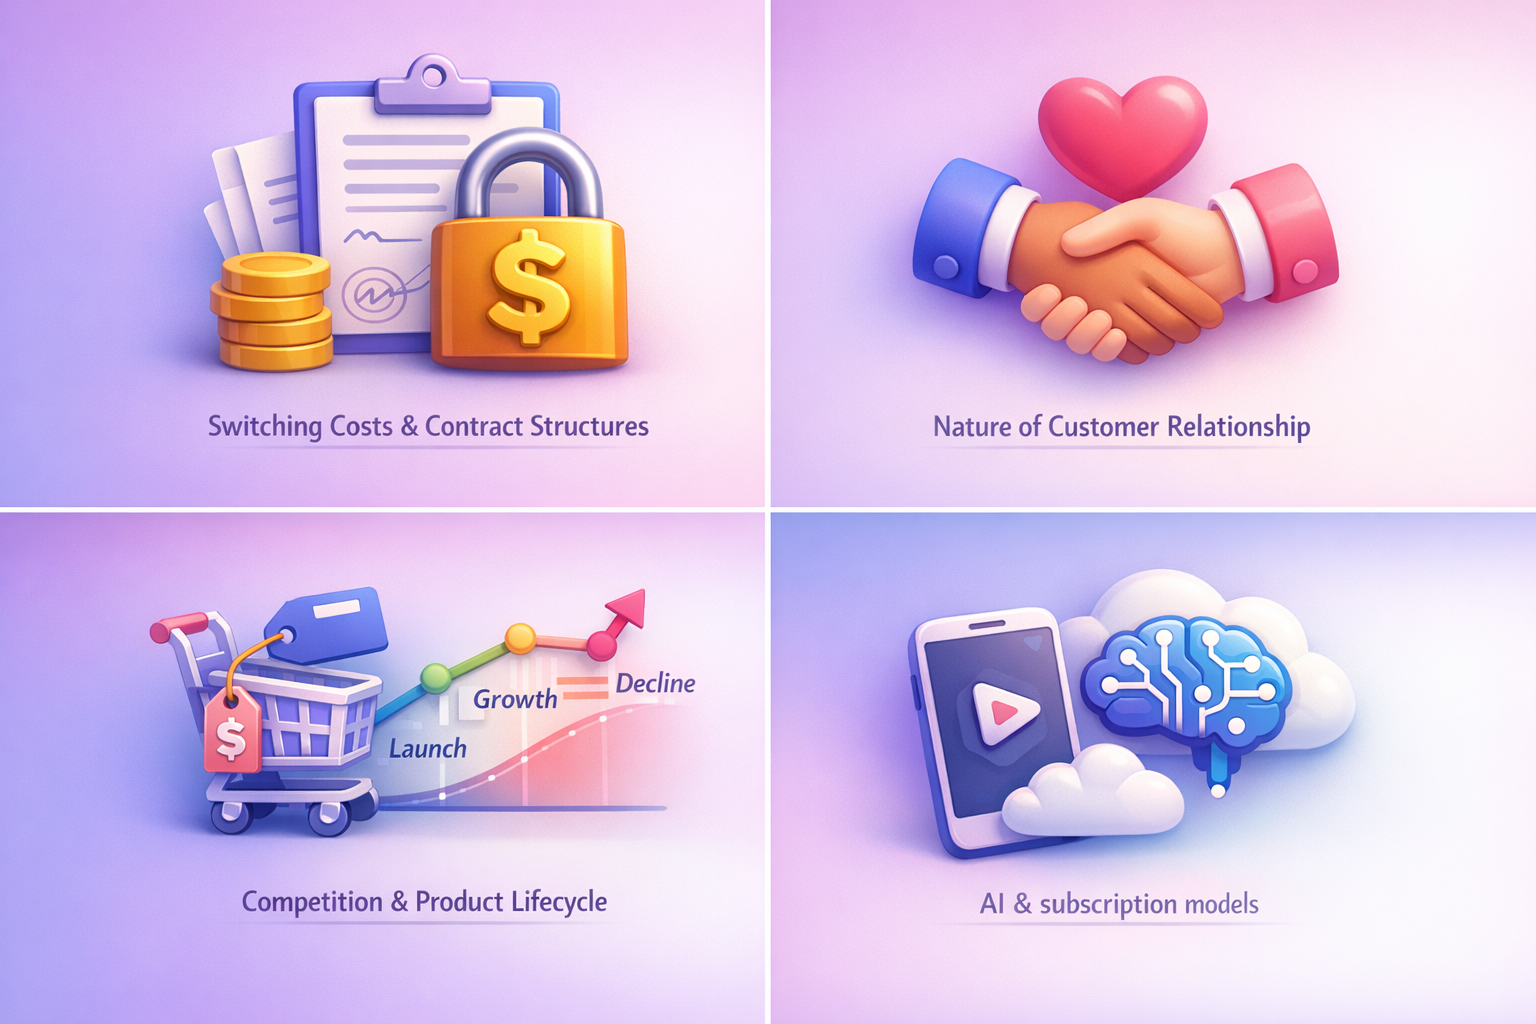
Switching costs & contract structures
Switching costs create natural retention barriers. These costs can be financial, operational, psychological, or time-based.
- Monetary & Legal Barriers: SaaS (Enterprise) and Insurance use annual or multi-year contracts with early-termination fees, maintaining retention rates of 83%–95%.
- Procedural Friction: In Banking (75% retention) and IT Services (81% retention), the effort required to move data, reconfigure integrations, or change account numbers is a significant deterrent to churn.
- Artificial Barriers: Features such as “standard locking” in technology ecosystems (e.g., smartphone operating systems) keep customers locked in by preventing compatibility with other standards.
Nature of customer relationship
The more profound and individualized the engagement, the greater the chance of retaining.
- Proactive vs. Reactive: Professional Services (84%) and Financial Advisory succeed by shifting from Reactive to Proactive delivery.
- Trust and Necessity: In Healthcare (77%) and Automotive (83%), the need to retain customers centers on trust and life-cycle requirements.
- Transactional vs. Emotional: Retention levels for a transactional relationship (a single purchase) are low. On the other hand, a startling 65% of consumers report that emotionally engaging brands drive their loyalty program participation.
Market competition, product-life cycle & commoditization
Market maturity and product uniqueness directly affect a customer’s willingness to shop around.
Industries like Retail (63%) and Wholesale (56% churn) suffer because products are perceived as homogeneous. When price is the only differentiator, loyalty is fragile.
Hospitality and Travel (55%) have the lowest retention, as customers are overwhelmed by choices and often prioritize seasonal deals over brand loyalty.
Life Cycle Stages: During the Maturity stage of a product life cycle, companies face intensified competition and must shift focus from acquisition to retention programs to maintain market share.
Role of digital and subscription models
Digital transformation and the subscription economy are also influencing customer retention.
- Habitual Engagement: Media (84%) has a high retention rate because its subscription service offers unlimited, advertisement-free content, creating a habit among its audience.
- Flexible Pricing: Modern digital models are moving toward Usage-Based (Consumption) pricing. 67% of consumers prefer this over flat fees, as it feels more “fair” and reduces the feeling of being “locked in.
- AI Personalization: In 2026, companies using AI for real-time personalization are 60% more likely to see repeat buyers. AI helps detect “at-risk” subscribers before they churn by analyzing behavior patterns.
How to use these benchmarks for your business
In 2026, using retention benchmarks means moving beyond simple percentages to build a data-driven “flywheel” that turns existing customers into your primary engine for growth.
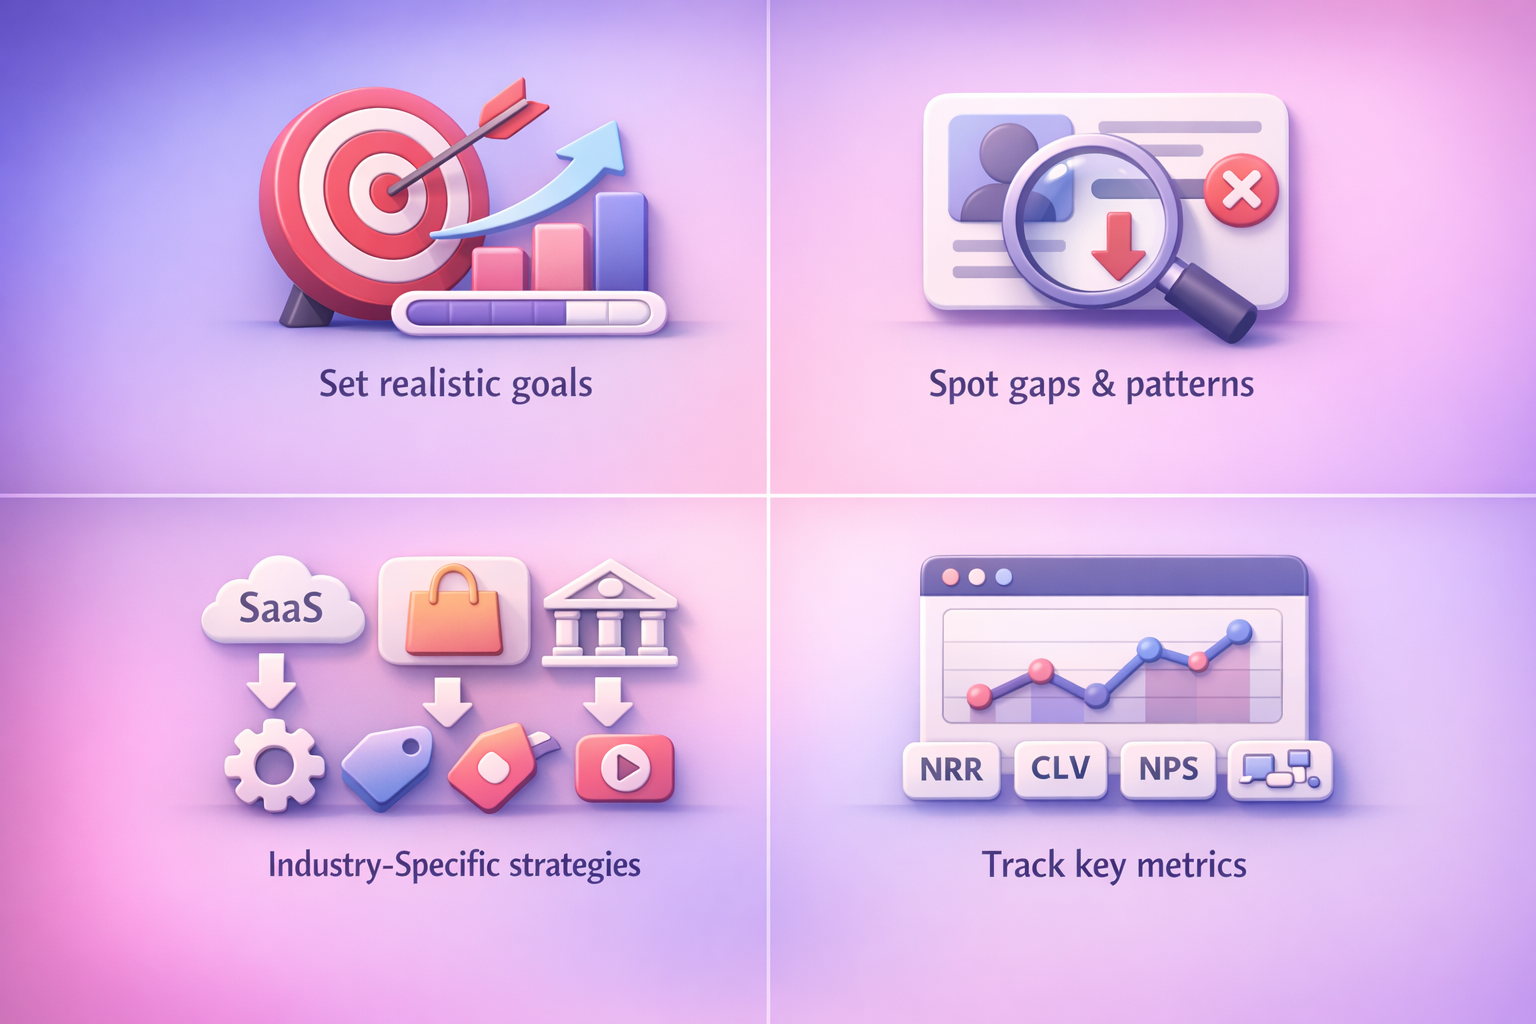
Setting realistic retention goals
Start by calculating your current rate using the standard formula:
CRR = [(E – N)/S] x 100
Where E is the number of customers at the end of the period, N is the number of new customers added, and S is the number of customers at the start.
A “good” rate is relative. A 85%–90% target is considered healthy for B2B SaaS growth, while 60%–70% is considered strong for the more volatile Retail and E-commerce sectors.
Avoid setting unrealistic “all-at-once” targets. If your current rate is 75% and the 2026 industry average is 85%, aim for 80% within the next six months.
Identifying retention gaps and starting points
Identify where customers “leak.” For example, if Subscription Box customers typically drop off at “Box 3,” that is your primary intervention gap.
Identify patterns:
- When do customers churn? (First 90 days vs. later)
- Which customer segments churn fastest?
- What triggers churn? (Price, experience, competition?)
- Which acquisition channels produce the best retention?
Use metrics like login frequency and feature usage to create a “Health Score.” A sudden drop in these signals indicates a gap that requires proactive outreach before the customer officially churns.
Industry-specific strategy pointers
- SaaS & IT: Shift from reactive support to Success Programs. Use time-based activation triggers that nudge users to adopt specific features based on their individual usage patterns.
- Financial Services: Emphasis on Goal-Oriented Paths. Shift from sending generic newsletters in financial-based communications to specific recommendations tailored to the stage of the individual’s life, whether it is retirement or developing credit.
- Retail & E-commerce: Leverage Integrated Loyalty Solutions. Combine multiple engagement points (online, in-person, social) into a single customer view. Reward for individual behaviors, with ‘surprise and delight’ achievement points, is more rewarding than discounts.
- Media & Entertainment: Combat “content fatigue” with Behavioral Nudges. Trigger personalized recommendations 48-72 hours after session inactivity to draw users back into a binge cycle.
Key metrics and monitoring
- Net Revenue Retention (NRR): This is the gold standard for 2026, especially for B2B. It tracks not just who stayed but also how much more they spent on upgrades.
- Customer Lifetime Value (CLV): Use CLV to prioritize resources.
- Net Promoter Score (NPS): Monitor it as a leading indicator of emotional loyalty.
- Omnichannel Tracking: Ensure your monitoring captures interactions across all platforms, social media, email, and in-app, to provide a unified view of the customer experience.

All your reviews in one place
Collect reviews, manage every response, and display them where they matter most.
Start Free →4 Emerging trends influencing retention
The fusion of intelligence and human values shapes customer and employee retention. These are the four key trends that will transform customer loyalty:
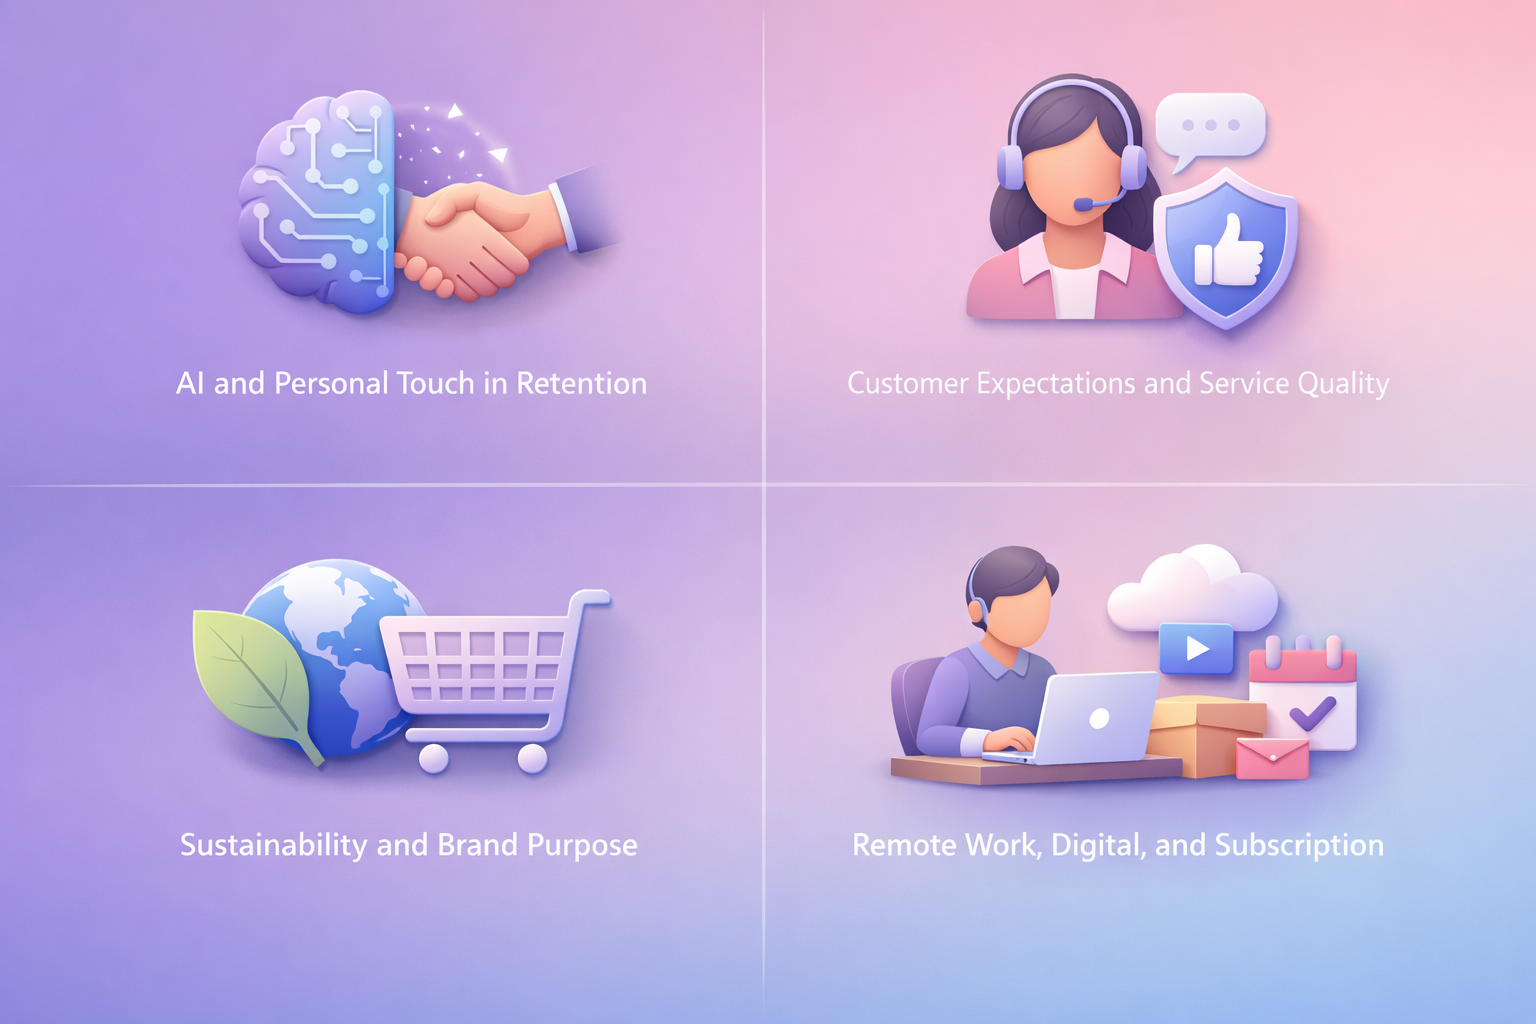
1. AI and personal touch in retention
AI-powered hyper-personalization, such as predictive churn notifications, leverages technology with empathy for consumers to improve customer retention rates by at least 10% across the software and retail industries.
Instead, AI serves as an “intelligent partner,” summarizing engagements and helping craft a caring response so that the human agent can handle more complex communications.
2. Customer expectations and service quality
In 2026, the factors of quality and price are no longer what matter, but instead, “quality of experience.”
Instead, leading brands are now taking a proactive approach to problem prevention, such as the airline industry rebooking passengers before announcing an anticipated delay.
3. Sustainability and brand purpose
The retention rate for brands that support eco-values is 20% higher. People are willing to overpay (up to 16.4%) for products from manufacturers that provide real-time proof of their commitment to ethics and the source of their components.
More than 80% of consumers expect companies to contribute to environmental improvement, especially younger consumers, who view purchasing as a way to address social issues.
4. Remote work, digital use, and subscription fatigue
The way people work and consume digital services is prompting a renewed focus on how brands retain their attention.
In a business setting, 76% of employees would quit if the company did not allow them to work from home.
With consumers flooded by the number of digital options available, brands have shifted away from the concept of a “static” subscription service and toward the idea of an “evolving” subscription service.
Wrap up
Customer retention rates vary significantly across industries due to factors like switching costs, customer relationships, and competition. Understanding these differences is essential for setting realistic goals.
Industries focusing on personalized experiences, proactive service, and AI-driven solutions are better positioned to improve retention.
By applying industry-specific strategies and regularly evaluating performance, businesses can effectively address retention gaps.
This will help turn customer loyalty into a key driver of growth.
Also see:
Frequently asked questions
Typical customer retention rates range from 35% to 84%, depending on the market.
Use this formula: (Customers at end of period - New customers) / Customers at start of period × 100. For example, if you start with 150 customers, end with 120, and acquire 5 new customers, your retention rate is 76%.
Retention costs 5 times less and generates more revenue from repeat customers.
Product quality, customer service, deals, personalization, and emotional connection.