8 min
8 min 
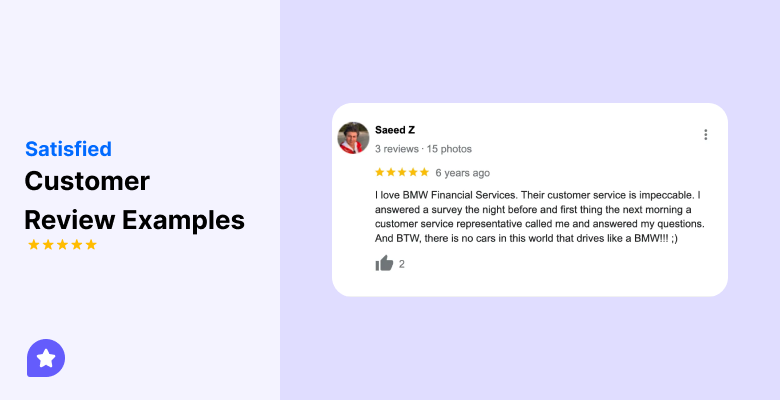
Customers don’t respond the same way anymore. They have more options, less tolerance, and drive new heights of expectation than ever before. One poor experience, and they’re gone.
Customer loyalty drives repeat sales, steady revenue, and long-term growth. Brands that keep customers coming back spend less on ads and earn more over time.
The 2026 data indicate how customer loyalty influences purchase behavior, retention rates, and customer lifetime value. It also indicates factors influencing customer loyalty and future trends.
This article lists 51 new customer loyalty statistics that answer these questions fast. Each stat highlights what works, what fails, and where innovative brands focus next.
Top highlight
Before we dive deep, here’s what you need to know:
- The global loyalty management market came in at a whopping $15.19 billion in 2026 and is predicted to be over $18.2 billion by the end of 2026.
- Loyal customers spend 67% more on products and services than brand new customers.
- Loyalty members generate 12% to 18% more incremental revenue annually than non-members.
- 90% of companies report a positive ROI from loyalty programs, with returns averaging 4.8x to 5.2x their investment.
- 32% to 33% of consumers will abandon a brand they love after just one bad experience.
- Increasing customer retention by just 5% can boost profits by 25% to 95%.
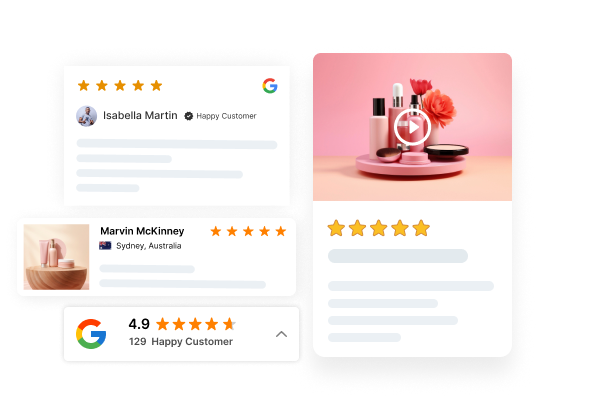


All your reviews in one place
Collect reviews, manage every response, and display them where they matter most.
Market & programme landscape
The loyalty program market is absolutely booming and pretty much every business has some form of loyalty initiative on the go. Get a handle on the current state of play before investing any more resources.
Global market value & growth
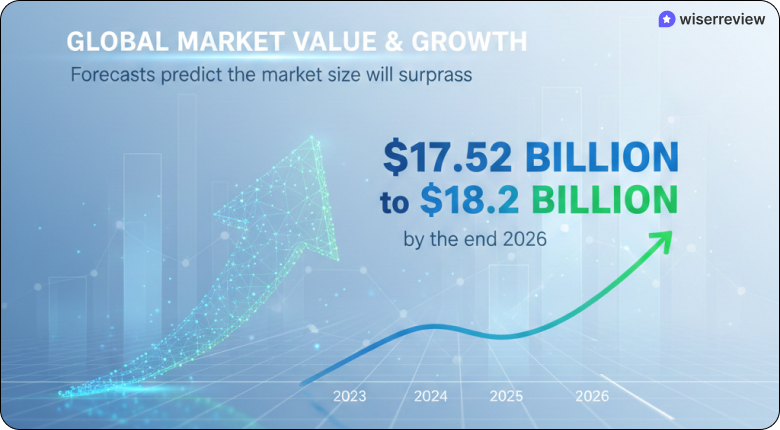
1. Forecasts predict the market size will surpass $17.52 billion to $18.2 billion by the end of 2026.
2. The Expansion rate of the industry is growing at a robust CAGR of 15% to 19.71%.
Regional adoption & performance
3. North America: Remains the largest market, holding a 40% global share due to early AI adoption and mature retail ecosystems.
4. Asia-Pacific: This is the fastest-growing region, with a projected CAGR of over 20% through 2035.
5. Australia: Leads in per-capita participation, with 61% of consumers actively engaging in programs, the highest rate globally.
Program participation & engagement benchmarks
6. Over 90% to 91% of companies globally have implemented a loyalty program as of late 2026.
7. While the average U.S. consumer belongs to 16.7 programs, they only actively engage with 6 to 7.
8. In 2026, Roughly 59% of consumers are more likely to join a program now than 12 months ago; this sentiment rises to 72% among Millennials and Gen Z.
Corporate investment & ROI
9. Loyalty and CRM now account for 31.4% of total marketing budgets, a 4.4% year-over-year increase.
10. 90% of program owners report positive ROI, with the average program generating 5.2x its cost.
11. 54% of programs now offer non-transactional benefits (events, early access) in addition to points.
12. 18% of consumers now use subscriptions specifically to demonstrate and maintain their brand loyalty.
Drivers of customer loyalty
What makes customers stay loyal in the first place? It’s not just about price, although price does matter. Customers stay because you get them, serve them well and you’re all on the same page when it comes to values.
Primary drivers of loyalty
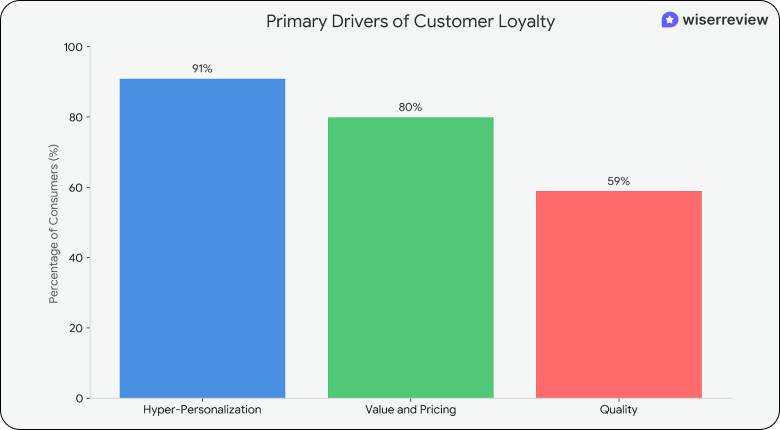
Customer Experience (CX) & Quality: For the first time, quality and experience have surpassed price as the leading drivers of brand commitment.
13. Quality: 59% of consumers cite high-quality products as their top driver of loyalty.
14. Consistent Experience: 80% of customers state that the experience a company provides is just as necessary as its products.
15. Trust & Reliability: Customers who trust a brand are 88% more likely to be repeat buyers.
16. Hyper-Personalization: 91% of consumers now prefer brands that offer personalized content and offers.
17. Value & Fair Pricing: 60% of consumers switched brands in 2026 specifically due to rising costs. 80% of consumers prioritize “value for money” as their top driver for brand choice in 2026.
Emotional & ethical drivers
18. Emotional Connection: Customers with an emotional bond to a brand have a 306% higher lifetime value (LTV) than those who are only satisfied.
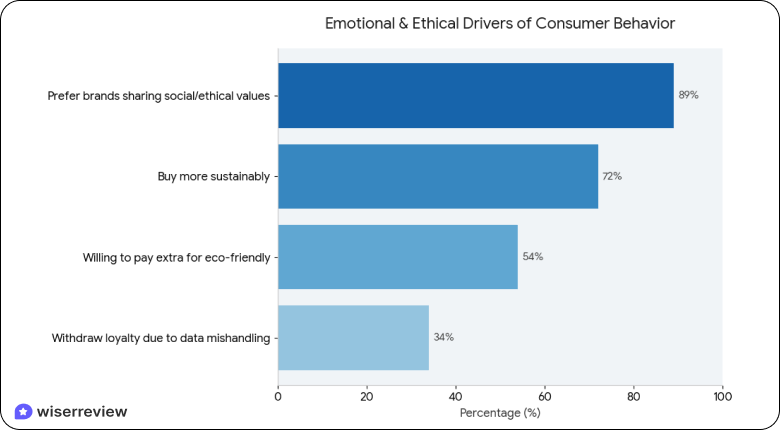
19. Shared Values & ESG: 89% of consumers prefer brands that share their social or ethical values.
20. Safety: 72% of consumers now buy more sustainably, with 54% willing to pay extra for eco-friendly products.
21. Data Privacy: Trust is increasingly tied to data privacy, with 34% of consumers withdrawing loyalty if their data is mishandled.
The “new” trend in loyalty
22. Viral Influence: 14% of consumers are now “Trend Loyal,” forming intense but short-lived attachments to brands based on viral social media buzz (e.g., TikTok drops).
23. Hype-Driven: 20% of consumers feel emotionally connected to products purely because they are trending.
Behavioural signs of loyalty
In 2026, loyalty is increasingly defined and measured using observable behavioral data rather than people simply expressing what they believe in surveys.
As ‘True Loyalty’ (deep emotional bonds) has taken a 5% hit since 2024, brands are shifting their focus towards identifying specific behavioural markers that show high-value retention is on the cards.
Purchase velocity and probability
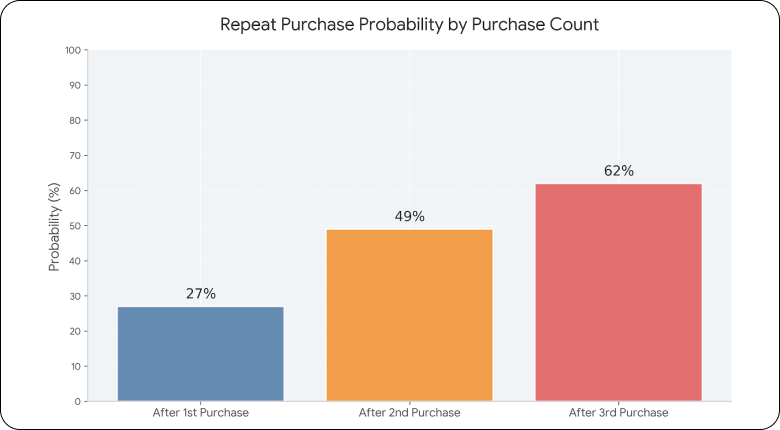
24. After a first purchase, there is a 27% chance a customer will return.
25. After a second purchase, that probability jumps to 49%.
26. By the third purchase, the likelihood of a repeat visit exceeds 62%.
Incremental spending habits
27. Repeat customers spend 67% more on average in months 31–36 of their relationship than they did in their first six months.
28. Existing customers are 50% more likely to try new products compared to new prospects.
Engagement-based signals
29. App Usage Frequency: In 2026, 80% of customers are willing to download a brand’s mobile app for loyalty; truly loyal members use these apps weekly or daily to track rewards.
30. Silent Loyalty: A significant 53% of consumers are “silent loyalists”; they make consistent, repeat purchases but do not actively engage in social media or community events.
31. Omnichannel Activity: Customers using multiple channels (e.g., buying online but picking up in-store) show a 250% higher purchase frequency than single-channel shoppers.
Advocacy & word-of-mouth
32. Referral Rate: 86% of loyal customers will recommend a brand to friends and family.
33. The presence of a high-quality loyalty program makes over 70% of consumers more likely to recommend a brand.
Repeat purchases and referrals often follow visible social proof. Platforms such as WiserReview turn reviews, ratings, and customer feedback into on-site trust signals that support retention and repeat buying.

All your reviews in one place
Collect reviews, manage every response, and display them where they matter most.Impact of bad experience
34. About 50% of consumers would switch to a competitor after a single negative customer experience. For more than one bad experience, the rate increases to 80%.
35. 78% customers will forgive with good recovery, 33% will switch after one bad experience.
Generational & demographic differences
Not all customers approach loyalty the same way. Generational differences create distinct expectations, and your strategy must adapt accordingly.
Generation Z (Ages 14–29): The values-driven digitalists
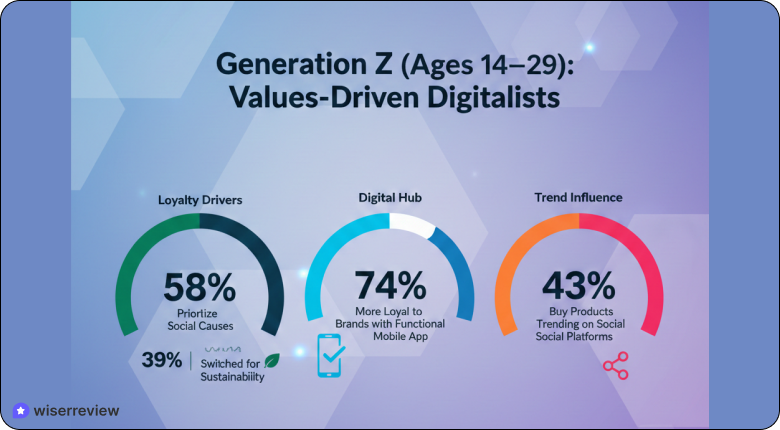
36. Loyalty Drivers: Prioritize social causes (58%) and sustainability (39% have switched brands over poor environmental practices).
37. Digital Hub: 74% are more likely to be loyal to brands with a functional mobile app.
38. Behavior: They are the least likely to join loyalty programs quickly. However, 21% will pay a premium to show brand commitment.
39. Trend: 43% of Gen Z buy products because they’re trending on social platforms.
Millennials (Ages 30–45): The reward optimizers
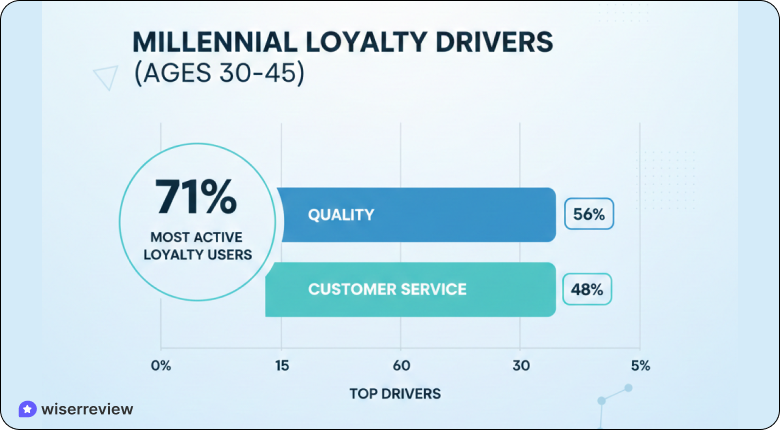
40. Loyalty Drivers: The most active loyalty users (71%). They prioritize quality (56%) and customer service (48%) as top drivers.
41. Spending Impact: Millennials are 278% more likely than Baby Boomers to increase their spending when enrolled in a loyalty program.
42. Engagement: 42% show loyalty by installing a brand’s app, and 34% engage through social media.
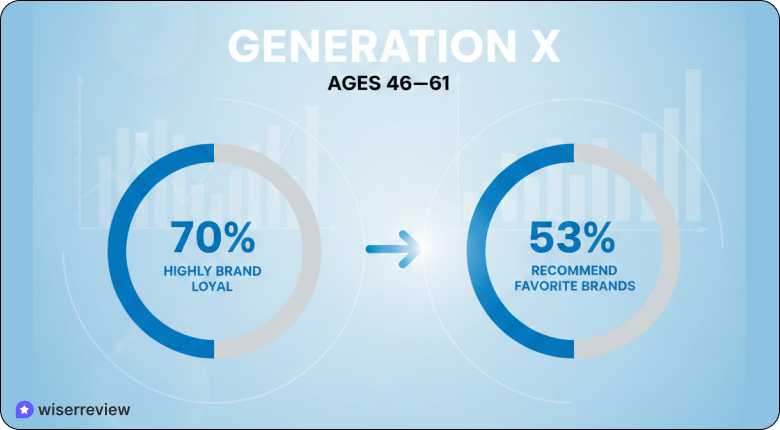
Generation X (Ages 46–61): The consistent advocates
43. Loyalty Drivers: Value purchase frequency (72%) and established brand trust over novelty.
44. Behavior: 70% identify as “highly brand loyal” to established names. 53% consistently recommend their favorite brands to others.
45. Market Power: Gen X is projected to lead global consumer spending from 2026 through 2036, reaching an estimated $15.2 trillion in spending capacity.
Threats to loyalty & why customers switch
Loyalty is fragile. Multiple factors can destroy years of relationship-building in moments. Knowing the threats helps you protect against them.
Top reasons for switching
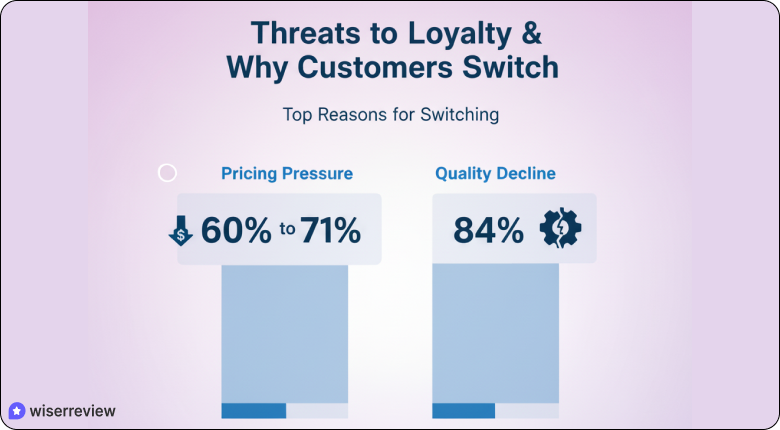
The primary “dealbreakers” that cause customers to abandon brands are rooted in pricing and the quality of the core experience.
46. Pricing Pressure: 60% to 71% of consumers will switch to a competitor for lower prices.
47. Quality Decline: 84% of consumers would leave a brand over poor product or service quality.
48. Customer Experience (CX) Failures: Poor service is a rapid loyalty-killer, with 47% to 72% of customers walking away after rude or unhelpful interactions.
Emerging threats to loyalty
49. Failing Personalization: 65% have switched brands because membership programs failed to deliver a better experience.
50. Ethical Misalignment: 56% of consumers consider unethical behavior a dealbreaker.
Future trends & what to monitor
The loyalty landscape is evolving rapidly. AI, personalization, and changing customer expectations will define success in 2026 and beyond.
AI-driven “outcome-based” loyalty
AI is transitioning from experimental chatbots to sophisticated orchestration engines that manage the entire customer journey.
AI and personalization get bigger: 39.6% of consumers say they would be more likely to join a loyalty program if it used AI to improve personalization.
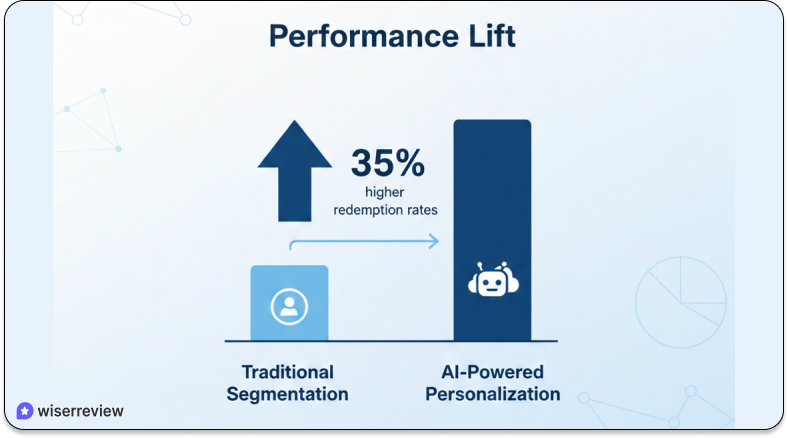
Performance Lift: Companies using AI-powered personalization report up to 35% higher redemption rates than those using traditional segmentation.
Efficiency: By 2026, conversational AI for customer service is projected to reduce contact center labor costs by $80 billion.
The Rise of “trend loyalty” & “silent churn”
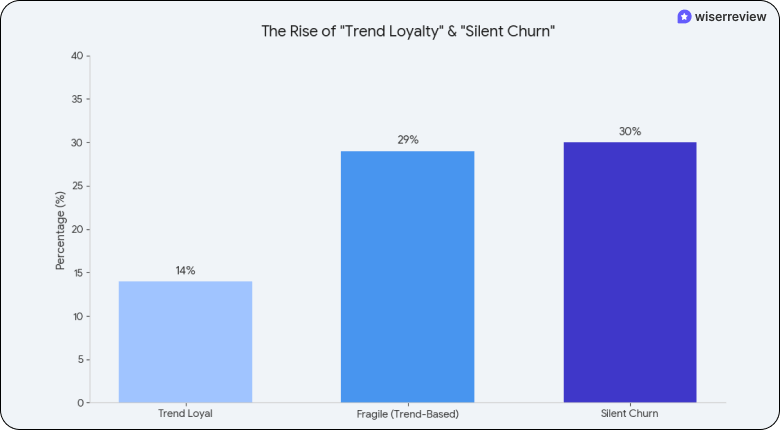
New consumer segments are emerging that defy traditional brand-building strategies.
Trend Loyalty: Approximately 14% of consumers are now “Trend Loyal”, forming intense, short-term attachments based on viral social media content.
Fragility: 29% of these consumers report losing interest quickly when a product stops trending.
Silent Churn: Feedback is declining; 30% of customers who leave a brand do not tell anyone, they simply switch silently.
All your reviews in one place
Collect reviews, manage every response, and display them where they matter most.How to use these statistics for your loyalty strategy
Raw statistics mean nothing without action. Here’s how to apply these insights to build a loyalty program that actually works.
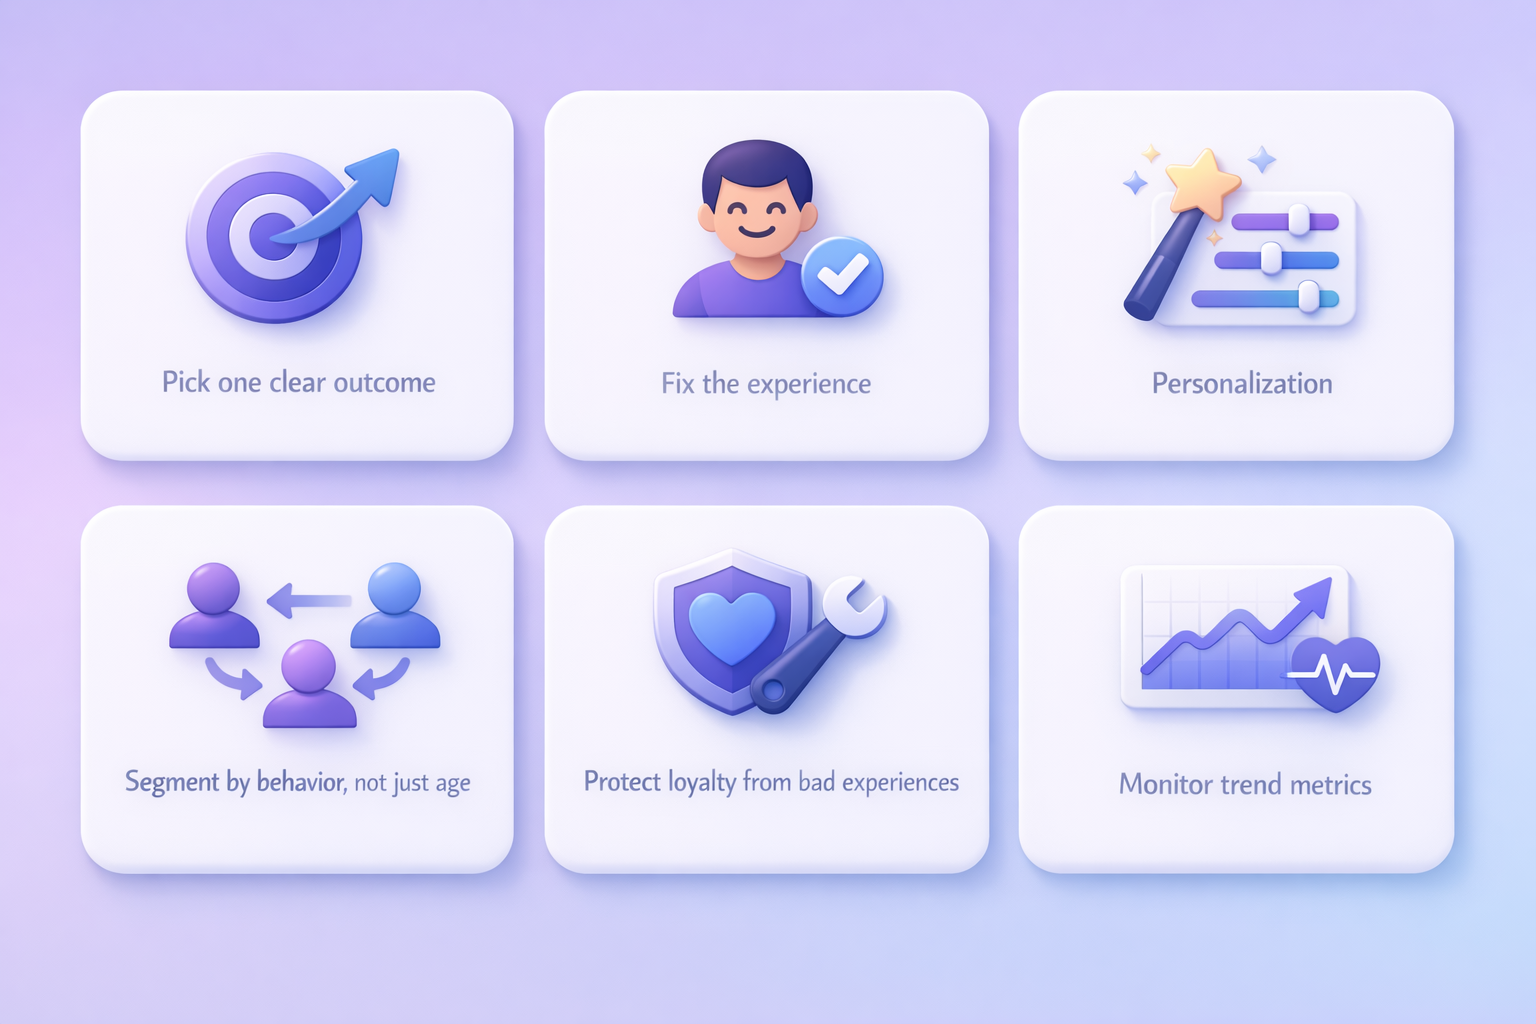
1. Pick one clear outcome, then map the stats to it
Do not try to “improve loyalty” in general. Select one outcome, such as retention, repeat purchase rate, redemption, or referral rate. Then use your statistics to demonstrate why that outcome matters and which lever to pull.
Example: If you want profit growth, start with retention because a 5% retention lift can raise profits by 25% to 95%.
2. Fix the experience before adding rewards
Loyalty breaks when the experience does not improve. Since 65% of customers switch when membership programs fail to deliver real value, use the stats to justify better service, faster support, and smarter offers first.
3. Personalize where it changes buying behavior
Apply personalization to moments that move revenue. Use it in onboarding, product suggestions, and reward choices. Do not personalize everything. Fix the steps that lead to a second and third purchase.
4. Segment by behavior, not just age
Group customers by actions like first-time buyers, repeat buyers, high spenders, and at-risk users. Then adjust by generation. Behavior predicts loyalty and revenue better than demographics alone.
5. Protect loyalty from bad experiences
One poor experience can end the relationship. Use recovery triggers like fast support, follow-ups, or make-good rewards to prevent churn before it becomes permanent.
6. Monitor these trend metrics in 2026
These help you spot loyalty shifts early:
- “Silent churn” rate (customers who stop buying without complaints)
- App engagement by member tier
- Reward liability and breakage
- Redemption rate changes after personalization tests.
Wrap up
Customer loyalty in 2026 is all about experience, value, and relevance, not just rewards. The data shows customers stay when you get them, respect their time, and deliver consistently.
These 51 statistics make one thing clear: loyalty drives higher spend, stronger retention, and long-term growth – but it breaks fast when expectations are missed.
Use these insights to plug the gaps, double down on what works, and build loyalty that lasts beyond the next purchase. Tools like WiserReview support this approach by turning customer feedback into visible trust that drives repeat purchases.
Also see:
Frequently asked questions
Around 70%–75% of consumers say they are loyal to at least one brand, but only 25%–30% show true emotional loyalty.
The top reasons are price increases, poor quality, bad customer service, and weak personalization, with 85%+ willing to switch for better rewards.
Yes. Loyalty members drive 12%–18% more annual revenue, but only about half actively engage, so value and ease matter.
AI-powered personalization leads, with around 39.6% of consumers more likely to join AI-driven loyalty programs.