BigCommerce continues to attract growing mid-market and enterprise sellers while keeping a steady base of active stores.
Merchants on the platform are seeing higher sales, strong conversion rates, and broad adoption of headless setups and third-party integrations.
This report highlights 29 key BigCommerce statistics that explain how the platform is performing today across growth, sales, technology, and global reach.
Quick highlight
- BigCommerce has 40,000 active stores worldwide.
- The platform supports over 130,000 merchants in total.
- Merchants generate $34B+ in annual GMV.
- Stores process an average of 110,000–125,000 orders per day.
- Typical AOV is $137, with mobile AOV at $125.
- Average conversion rate is 2.5%, above the ecommerce norm.
- 93% of stores use Cloudflare for speed and security.
- 75% of merchants use third-party apps from the 1,200+ app marketplace.
- Around 30% of merchants run headless setups powered by APIs.
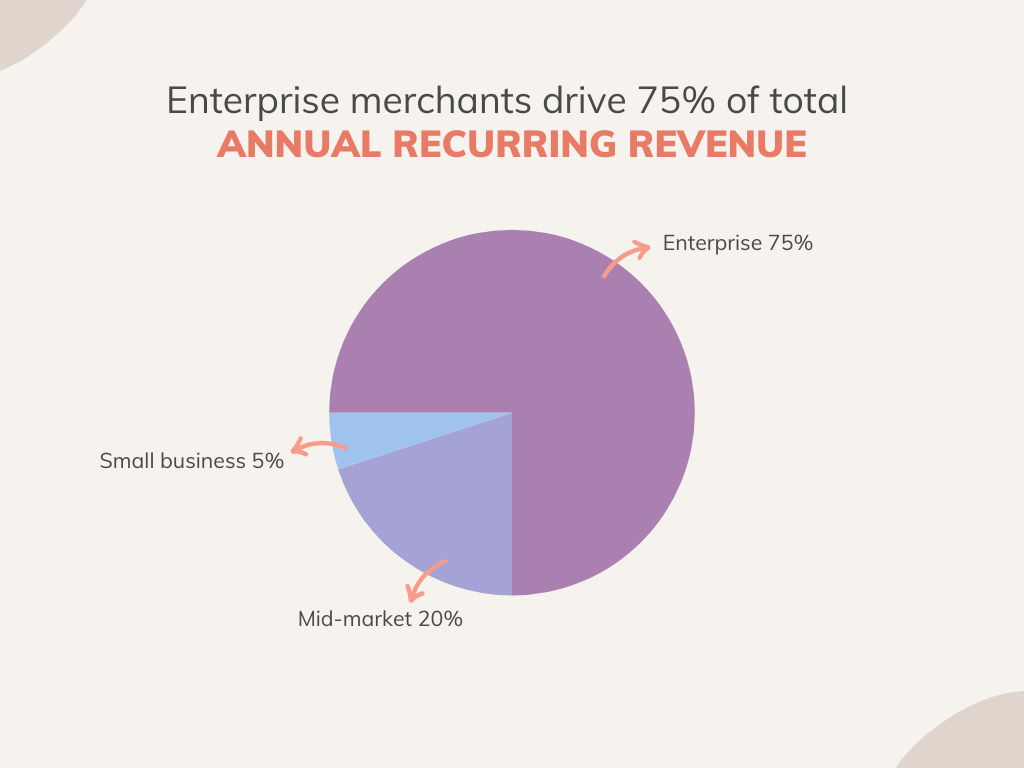
- Enterprise merchants account for 75% of total ARR, underscoring BigCommerce’s move upmarket.
Platform overview & market position
This section explains how BigCommerce is positioned in the ecommerce market, how many merchants use the platform, and how it compares to competitors.
BigCommerce merchant count & growth
1. 40,000 active stores operate on BigCommerce.
2. BigCommerce supports over 130,000 total merchants globally.
3. Active store count declined by about 6%, reflecting a shift toward higher-value merchants.
Market share relative to competitors
4. BigCommerce holds roughly 3% of the U.S. ecommerce platform market.
5. Its global share sits around 3.2%, placing it in the top five platforms worldwide.
6. The U.S. represents ~68% of all BigCommerce stores, making it the core market.
Enterprise vs small-business usage
7. 50–55% of merchants have fewer than 10 employees.
8. 35% operate with 10–100 employees, representing mid-market sellers.
9. Enterprise merchants drive 75% of total ARR, showing BigCommerce’s move upmarket.


All your reviews in one place
Collect reviews, manage every response, and display them where they matter most.
Sales performance & merchant outcomes

This section covers the sales performance merchants achieve on BigCommerce, including GMV, conversion rates, and seasonal results.
Average order value (AOV) & conversion rate
10. Platform-wide AOV is $137, while mobile AOV averages $125.
11. Average conversion rate is 2.5%, higher than the general ecommerce benchmark.
Gross merchandise volume (GMV) & growth
12. BigCommerce merchants generate $34B+ in annual GMV.
13. Stores process 110,000–125,000 orders per day on average.
14. Total order volume increased by 13%, indicating improved merchant performance.
Seasonal & event performance (e.g., Cyber week)
15. Cyber Week GMV grew 26%, significantly outperforming market averages.
16. Cyber Week orders increased 13%, with shoppers spending more per transaction.
17. BigCommerce maintained 100% uptime during every Cyber Week event for more than a decade.
Merchant demographics & business profile
This section covers who uses BigCommerce, age, company size, sector, and overall business makeup.
Merchant age, size, and employee count
18. 62% of BigCommerce merchants are between the ages of 25 and 44.
19. Average merchant tenure is 3.5 years, showing strong platform retention.
Industry sectors dominating BigCommerce
20. The largest categories include Home & Garden (16.7%), Apparel (13.7%), Automotive (7.8%), Sports (7%), and Business & Industrial (7%).
21. Non-U.S. merchants generate a disproportionate share of GMV, with the U.K. contributing 12% of platform-wide sales despite representing only ~6% of stores.
Geography and localization
22. U.S. stores: 68% of the base
23. U.K., Australia, and Canada together: 16%
Stores in Europe and APAC generate higher-than-average GMV relative to their store counts.
Technology, integrations & platform features

This section highlights how merchants build, customize, and extend their BigCommerce stores.
App ecosystem & third-party integrations
24. BigCommerce offers 1,200+ apps.
25. 75% of merchants use one or more third-party apps.
26. Cloudflare is installed on 93% of stores.
Headless commerce adoption & API usage
27. About 30% of merchants use headless commerce.
28. The platform handles 10B+ API calls per month, confirming strong reliance on integrations.
Performance metrics (site speed, mobile readiness)
BigCommerce delivers consistent uptime with strong mobile and desktop performance.
29. Mobile conversion averages 2.2%, slightly below desktop but above many retail benchmarks.

All your reviews in one place
Collect reviews, manage every response, and display them where they matter most.
Start Free →Marketing, traffic sources & conversion drivers
This section covers how BigCommerce merchants attract customers and convert traffic.
Traffic channels (organic, social, paid)
Merchants rely heavily on organic search, supported by built-in SEO.
Paid channels such as Google Ads and Meta Ads are widely used.
Social and marketplace integrations drive supplemental traffic for many merchants.
Social commerce & alternative payment trends
PayPal Express Checkout is used by 20% of all stores.
Many merchants add BNPL tools, social commerce extensions, and checkout accelerators.
Customer acquisition & retention metrics
75% of stores report retention rates of 50% or higher.
Merchant satisfaction rates remain high, with ~95% reporting positive experiences.
Global & regional insights

This section explains how BigCommerce performs across regions, where merchants are expanding, and how cross-border commerce is supported.
The platform remains strongest in North America but shows meaningful growth and higher revenue contribution from several international markets.
Growth in emerging markets
BigCommerce is gradually expanding outside its core English-speaking markets.
Adoption in Western Europe and APAC is rising as more merchants use localized storefronts and multi-currency features.
- Europe now represents about 26% of BigCommerce’s broader user presence, showing growing momentum beyond North America.
- Several emerging markets, including New Zealand, hold around 1% of the store base, a small but consistent share that signals steady international adoption.
Mobile commerce share by region
Mobile usage continues to increase across all regions.
European and APAC shoppers show stronger mobile-first behavior, while U.S. buyers still lean more on desktop during peak events.
Merchants in high-mobile regions are adapting storefronts to prioritize faster load times and simplified navigation.
Cross-border commerce and localization
BigCommerce supports global selling through multi-currency, region-specific tax rules, and localized payment options.
-
Royal Mail supports 945 BigCommerce stores, and Australia Post serves 1,100+ merchants, indicating strong regional fulfillment usage.
Merchants expanding internationally benefit from accurate shipping rates, localized delivery methods, and seamless multi-region checkout.
Wrap up
BigCommerce is shifting toward larger, more advanced merchants who rely on composable architectures, multiple storefronts, and API-driven workflows.
While the number of active stores is stable, the merchants using the platform are generating more sales and adopting deeper integrations.
The platform’s reliability, flexibility, and strong B2B capabilities position it as a leading option for brands that need more than a simple storefront.
Also see:
Frequently asked questions
BigCommerce has about 40,000 active stores, with a larger total merchant base of more than 130,000 globally.
The typical order on BigCommerce averages $137, while mobile shoppers spend about $125 per order.
BigCommerce supports all business sizes, but most growth comes from mid-market and enterprise sellers, who now generate 75% of the platform’s ARR.
Merchants on the platform process over 110,000–125,000 orders per day and generate more than $34 billion in annual GMV.
Most stores rely on integrations like Cloudflare (used by 93%+ of stores), Google analytics tools, marketing pixels, and over 1,200 apps available in the marketplace.