4 min
4 min 
Cart abandonment is a common issue in ecommerce. Around 70 percent of shoppers add items to a cart but leave without buying.
This happens across all industries and devices. For example, a shopper adds shoes to their phone, reaches checkout, sees high shipping fees, and leaves without paying.
This article shares the latest cart abandonment statistics and explains how to use them to improve checkout performance.
Top highlight
- About 70% of shopping carts are left without a purchase.
- Mobile shoppers leave carts more often than desktop users, at around 80%.
- Desktop cart abandonment is lower, at about 65% to 70%.
- Luxury and jewellery stores see the most abandoned carts, over 80%.
- Fashion and clothing stores lose around 8 out of 10 carts.
- Food and grocery stores have the lowest cart abandonment, around 50% to 56%.
- Extra costs at checkout make about 4 out of 10 shoppers leave.
- Forced account sign-up causes 1 in 4 shoppers to abandon checkout.
- Long or confusing checkout steps make about 1 in 5 shoppers quit.
- Abandoned cart emails bring back about 1 in 10 lost sales.
Global benchmarks for Cart Abandonment
This section explains how often shoppers abandon carts, how it changes by device and region, and how you can calculate your own rate.
These benchmarks help you compare your store against real averages instead of guessing.
Average rates across all industries
Across ecommerce, most carts do not turn into orders. On average, only about 3 out of 10 shoppers complete checkout.
This pattern stays consistent across most industries.
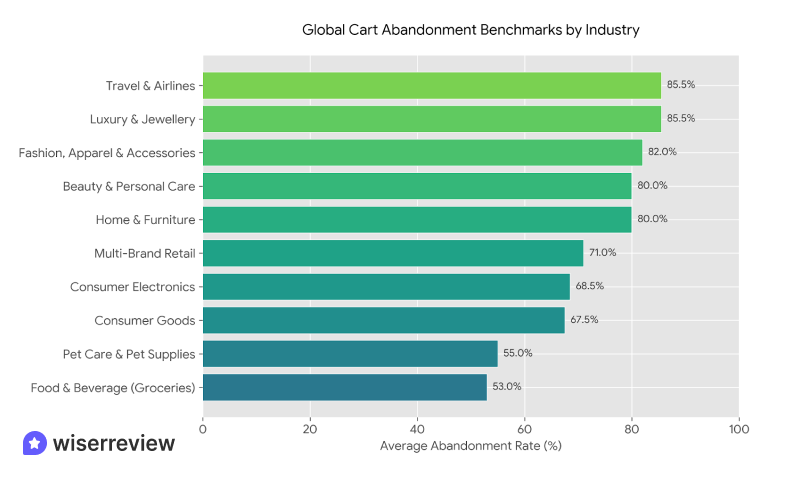
| Industry | Average Cart Abandonment Rate | Why Shoppers Leave |
|---|---|---|
| Luxury & Jewellery | 83%–88% | High prices, long decision time |
| Fashion, Apparel & Accessories | 78%–86% | Waiting for discounts, size doubts |
| Home & Furniture | ~80% | High shipping costs, long delivery |
| Beauty & Personal Care | ~80% | Brand comparison, reviews check |
| Travel & Airlines | 84%–87% | Price comparison across sites |
| Multi-Brand Retail | 70%–72% | Browsing behavior, many options |
| Consumer Electronics | 64%–73% | Price checks, feature comparison |
| Consumer Goods | 65%–70% | Repeat buying, faster decisions |
| Food & Beverage (Groceries) | 50%–56% | Essential items, strong intent |
| Pet Care & Pet Supplies | ~55% | Regular needs, repeat orders |
Device-specific rates (desktop vs mobile vs tablet)
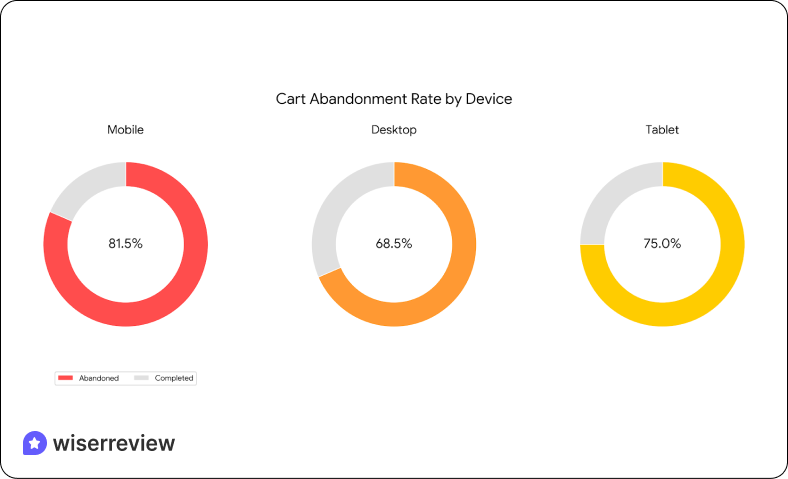
Cart abandonment changes a lot by device.
Mobile users abandon carts more often than desktop users due to small screens, typing effort, and slower checkout flows.
| Device | Average Abandonment Rate | Why It’s Higher or Lower |
|---|---|---|
| Mobile | 78%–85% | Small screens, slow forms, fewer payment options |
| Desktop | 65%–72% | Easier typing and better checkout experience |
| Tablet | 70%–80% | Mixed behavior between mobile and desktop |
Regional variations
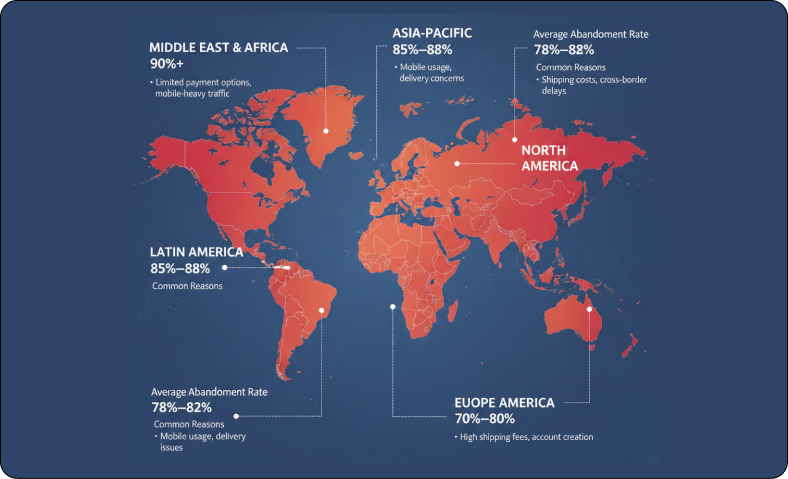
Where your shoppers live also affects cart abandonment.
Payment access, shipping speed, and mobile usage all play a role.
| Region | Average Abandonment Rate | Common Reasons |
|---|---|---|
| Middle East & Africa | 90%+ | Limited payment options, mobile-heavy traffic |
| Asia-Pacific | 85%–88% | Mobile usage, delivery concerns |
| Latin America | 85%–88% | Payment friction, trust issues |
| Europe | 78%–82% | Shipping costs, cross-border delays |
| North America | 70%–80% | High shipping fees, account creation |
How to calculate your own cart abandonment rate
Cart abandonment shows how many shoppers add items to a cart but do not complete the purchase.
Use this formula:
((Carts created − Orders completed) ÷ Carts created) × 100
Example:
If 1,000 carts are created and 300 orders are completed, 700 carts are abandoned. Your cart abandonment rate is 70%.
Track this by device and country to see where shoppers drop off most.


All your reviews in one place
Collect reviews, manage every response, and display them where they matter most.
Cart Abandonment rates by industry
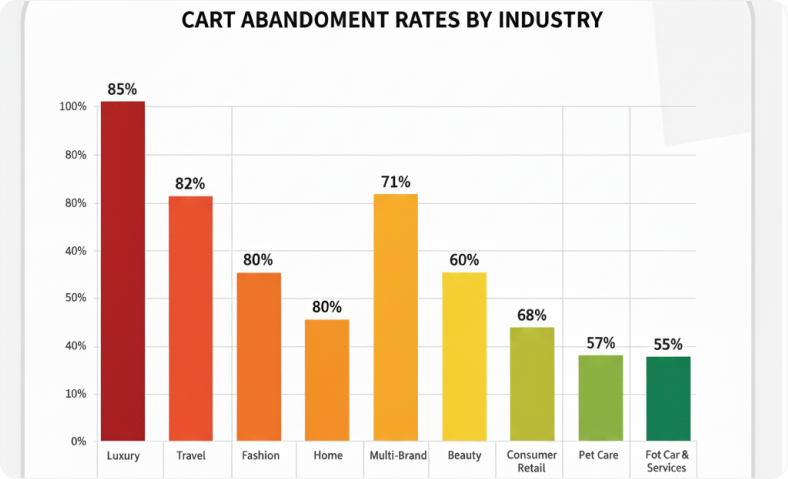
Cart abandonment changes by industry because buying intent, price, and urgency are different.
Below is a deeper breakdown with clear numbers and reasons.
Luxury & Jewellery
1. Luxury and jewellery have the highest cart abandonment, usually 83% to 88%.
These products are expensive and not urgent. Many shoppers use the cart as a shortlist.
They compare prices across sites, wait for discounts, or take time to decide. Trust, return policy, and insurance details strongly affect the final decision.
H3: Home & Furniture
2. Home and furniture stores see abandonment around 78% to 82%.
High shipping fees, long delivery times, and fear of damage during delivery cause hesitation. Shoppers also leave to check room size, measurements, or return terms before paying.
Fashion, accessories & Apparel
3. Fashion carts are abandoned 78% to 86% of the time.
Size and fit uncertainty is the biggest reason. Many shoppers also wait for sale events or promo codes.
4. Mobile users abandon fashion carts more often, with mobile abandonment running 10%–15% higher than desktop due to slow image loading and long checkout steps.
Beauty & Personal care
5. Beauty and personal care stores see abandonment close to 80%.
Shoppers compare brands, ingredients, and reviews before buying.
6. First-time buyers abandon carts about 20% more often than repeat buyers.
7. Subscription options can lower abandonment by 10% to 15% over time.
Multi-brand retail
8. Multi-brand retailers follow the general ecommerce average, around 70% to 72%.
Large catalogs encourage browsing. Shoppers often add multiple products to compare and return later. Clear filters, saved carts, and reminder emails help recover these users.
Consumer goods
9. Consumer goods show lower abandonment, around 64% to 70%.
These are everyday items with repeat demand. Shoppers move faster through checkout, especially if payment details are saved.
10. Repeat buyers convert up to 25% faster than first-time buyers. Free shipping thresholds reduce abandonment by around 8% to 12%.
Food & Beverage
11. Food and grocery stores have the lowest cart abandonment, around 50% to 56%.
These items are essential and often time-sensitive. Strong local delivery, clear stock availability, and fast checkout play a major role in keeping abandonment low.
Pet care & Veterinary services
12. Pet care sees abandonment near 55%. Many purchases are repeat orders like pet food or medicine.
Auto-reorder and subscription plans reduce abandonment by keeping checkout friction low.
Trust and safety matter more than discounts in this category.
Additional niche/vertical industries
Some other industries follow clear patterns:
13. Travel & airlines: 84% to 87% abandonment due to heavy price comparison
14. Electronics: 64% to 73%, driven by research and spec comparison
15. Digital subscriptions: show 70%+ abandonment on the first visit, but drop below 40% after a trial
16. B2B ecommerce: B2B ecommerce has 50% to 60% abandonment, with longer decision cycles of 2–6 weeks.

All your reviews in one place
Collect reviews, manage every response, and display them where they matter most.What causes shopping Cart Abandonment?
Shoppers usually leave the cart when something unexpected or frustrating appears during checkout.
Below are the main reasons, explained clearly and directly.
1. Unexpected costs at checkout (shipping, taxes, extra fees)
This is the top reason shoppers abandon carts.
17. Around 40% to 48% of shoppers leave when they see shipping fees, taxes, or extra charges added at the last step.
When the final price looks higher than expected, many shoppers choose to leave instead of paying.
2. Complicated or lengthy checkout process
A slow or confusing checkout causes many shoppers to quit.
18. About 17% to 20% of shoppers abandon their cart because checkout takes too many steps or asks for too much information.
Long forms, multiple pages, and unclear progress can cause users to lose patience.
3. Lack of preferred payment methods/trust issues
Some shoppers leave when they do not see their preferred payment method.
19. About 13% of shoppers abandon checkout if the payment option they trust is not available.
Others leave because they do not trust the site with their card details, especially if security signals are missing.
4. Mandatory account creation or forced sign-in
Many shoppers want to buy quickly.
20. About 25% of shoppers abandon checkout when forced to create an account or sign in.
Guest checkout helps remove this barrier, especially for first-time buyers.
5. Device & user experience issues on mobile
21. Mobile shoppers abandon carts 10% to 15% more often than desktop users. Slow load times affect over 50% of mobile exits.
22. Each extra checkout step on mobile increases abandonment risk by about 5%.
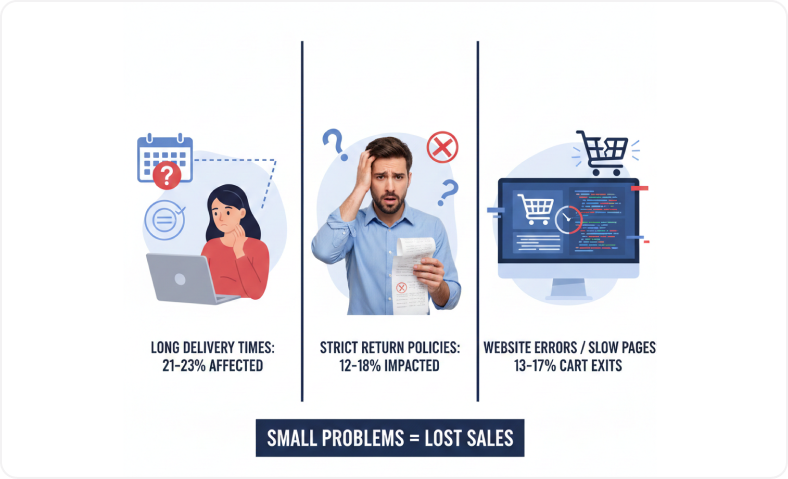
6. Other factors: long delivery times, returns policy, website errors
Some issues affect fewer users but still matter:
23. Long or unclear delivery times affect 21% to 23% of shoppers
24. Strict or unclear return policies impact 12% to 18%
25. Website errors or slow pages cause 13% to 17% of cart exits
Even small problems can cause shoppers to leave when they are close to paying.
Recovery & Optimization Strategies for Abandoned Shopping Carts
Cart abandonment cannot be removed fully, but it can be reduced and recovered. The strategies below focus on bringing shoppers back and removing the reasons they leave.
1. Cart recovery tactics (abandoned cart emails, retargeting ads)
26. Abandoned cart emails work well when sent within a few hours. On average, these emails bring back 10% to 15% of abandoned carts.
Simple reminder emails perform best, while discounts help recover users who hesitate on price.
Retargeting ads keep products visible after shoppers leave.
27. These ads remind users about items they already viewed and can lift conversions by 20% or more when used correctly.
2. Checkout process improvements
A smoother checkout reduces abandonment before it happens.
Shorter forms, fewer steps, and guest checkout help shoppers finish faster. One-page checkout and auto-fill reduce friction, especially on mobile.
28. Fixing common checkout issues can increase conversions by over 30%.
3. Transparent pricing & shipping clarity upfront
Price surprises cause most cart drop-offs.
29. Showing shipping costs early reduces abandonment by up to 20%.
Show shipping costs, taxes, and fees early in the cart. Display free shipping thresholds clearly. When shoppers know the final price upfront, they are more likely to complete the purchase.
4. Payment methods and trusted checkout
Choice builds confidence.
Offer multiple payment options like cards, digital wallets, and pay-later options. Show security badges and clear refund policies.
30. About 13% of shoppers leave when their preferred payment method is missing.
5. Metrics and tracking for conversion optimization
You cannot fix what you do not measure.
Track cart abandonment by device, traffic source, and country. Monitor recovery rates from emails and ads. Use this data to find weak points and focus on the changes that bring the most improvement.
31. Stores that act on this data improve checkout performance by 10% to 20% over time.
How to use these statistics to set goals & benchmarks

Cart abandonment statistics are useful only when they guide action. This section explains how to turn data into clear and realistic goals.
1. Benchmarking your ecommerce website
Start by comparing your cart abandonment rate with your industry average, not the global number.
A fashion store should compare itself with fashion benchmarks, while a grocery store should use grocery data. This gives a fair view of performance.
2. Setting realistic improvement targets
Do not aim for perfect conversion. Small gains matter.
32. Reducing abandonment by 5% to 10% can lead to meaningful revenue growth. A 10% reduction often leads to strong growth without discounts.
Focus on steady improvement instead of quick wins.
3. Segmenting by device, traffic source & industry
Always break data into smaller parts. Compare mobile vs desktop, paid ads vs organic traffic, and new vs returning users.
This shows where shoppers drop off most and where fixes will have the biggest impact.
4. Aligning average order value and customer behaviour
33. High average order value increases abandonment by 15% to 25% compared to low-cost products.
If your products cost more, expect higher abandonment. Use trust signals, clear returns, and flexible payments to support these buyers.
5. Using the data to prioritize optimization efforts
Fix the biggest problems first. Start with checkout speed, pricing clarity, and mobile experience.
Use recovery data to decide which changes bring the best results.
All your reviews in one place
Collect reviews, manage every response, and display them where they matter most.Conclusion
Cart abandonment is common in ecommerce. Most shoppers leave due to extra costs, slow checkout, or lack of trust.
The data shows clear patterns. Mobile carts drop more often, high-priced items see more hesitation, and essential products convert better.
Use these insights to fix checkout issues, show transparent pricing, and recover abandoned carts. Small changes can bring back real sales.
Also see:
Frequently asked questions
The average cart abandonment rate is around 70%. This means most shoppers add items to a cart but leave before completing the purchase.
Luxury, jewellery, fashion, and travel have the highest cart abandonment rates, often above 80%. High prices and longer decision times are the main reasons.
Mobile checkout is harder to complete. Small screens, slow loading, and long forms cause mobile cart abandonment to be 10% to 15% higher than desktop.
The top reason is unexpected costs at checkout, such as shipping fees or taxes. Around 40% of shoppers leave when the final price is higher than expected.
You can reduce cart abandonment by simplifying checkout, showing total costs early, offering guest checkout, adding trusted payment options, and sending abandoned cart reminders.